Dashboard Overview
Overview:
The dashboard is your all-in-one hub for viewing analytics and stats that can help you enhance your performance.
Table of Contents
Access PBX.IM's Dashboard
To access PBX.IM, simply go to https://app.pbx.im/login and enter the credentials you've created when signing up for using PBX.IM.
Admin view
As an admin, you will have access to multiple insights and data about your agents, call queues, and overall call performance. We will go through each of the following sections one by one and explain how you can use them:
- Filter section
- Summary
- Queue Call Stats
- Queues
- Agents
Filter section

On the filter section you will be able to see the following:
| Type | How to use |
|---|---|
| Time and Date | The current time and date when you log in. |
| Queue Selector | Allows you to filter the displayed data by specific call queues. Read more about this functionality in this section-> Call Queues . |
| Team Selector | Allows you to filter the displayed data by specific teams. |
| Date Selector | Allows you to select the date for which you want to view the call data |
Summary
In the summary section, you will see an overview of the most important metrics as follows:
| Type | Explanation |
|---|---|
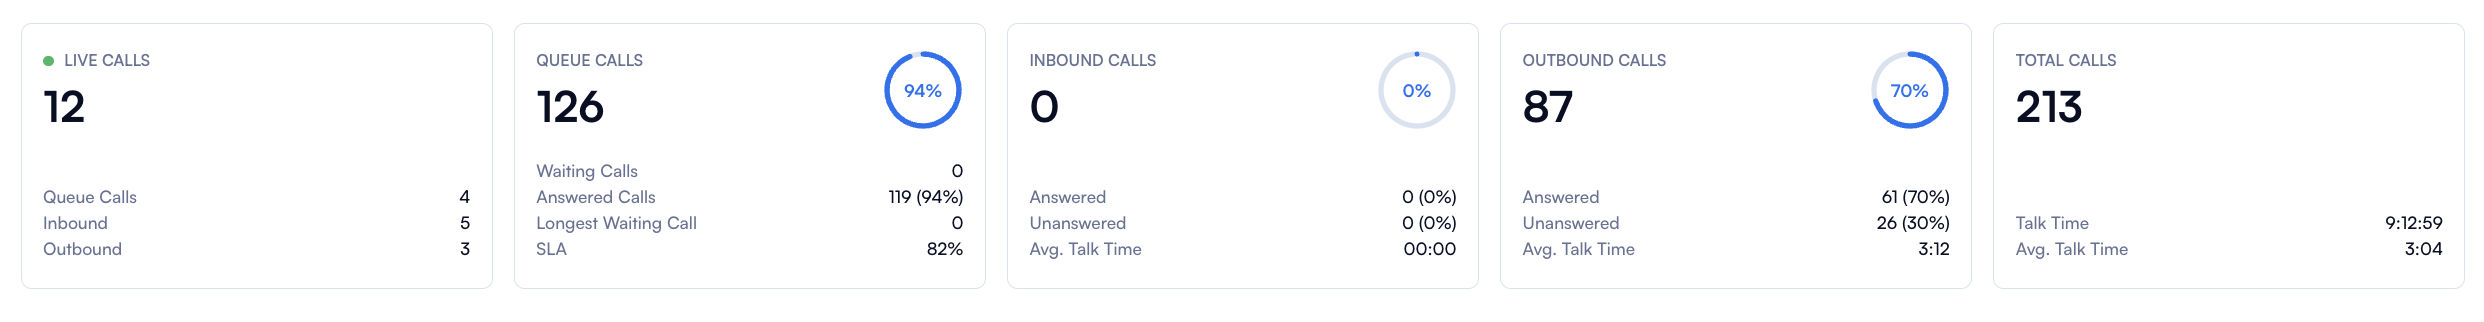
| Live calls | The number of ongoing calls at the moment is displayed, with a breakdown by call type. |
| Queue Calls | Information about calls in the queue includes a breakdown of waiting calls, answered calls, longest waiting call and the SLA. |
| Inbound Calls | Here, you get an overview of inbound calls, along with detailed stats on answered calls, unanswered calls, and average talk time. |
| Outbound Calls | This is similar as inbound calls. You will be able to see the same stats. |
| Total Calls | In this section, you will see the total number of calls handled and also what was the talk time and the average talk time. |
Call Stats
How to use it:
Chart:
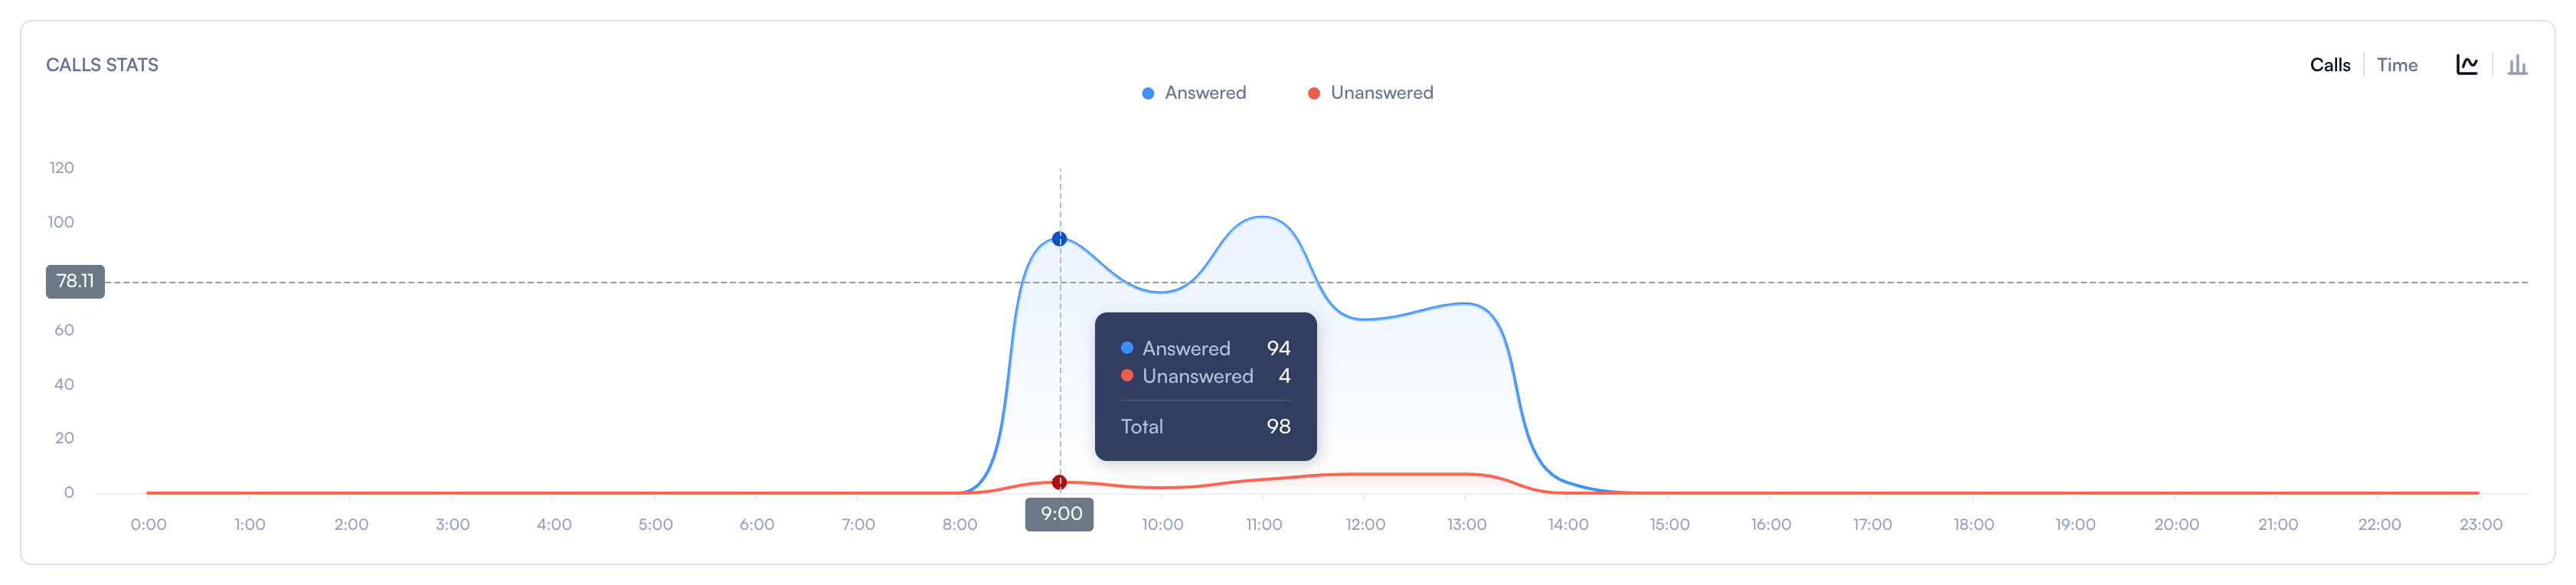
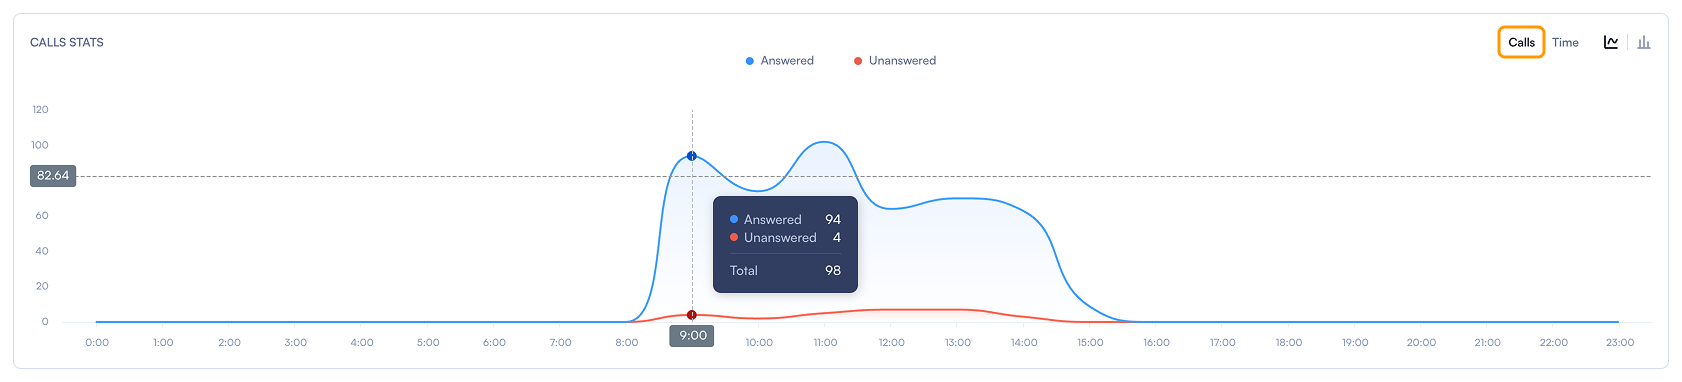
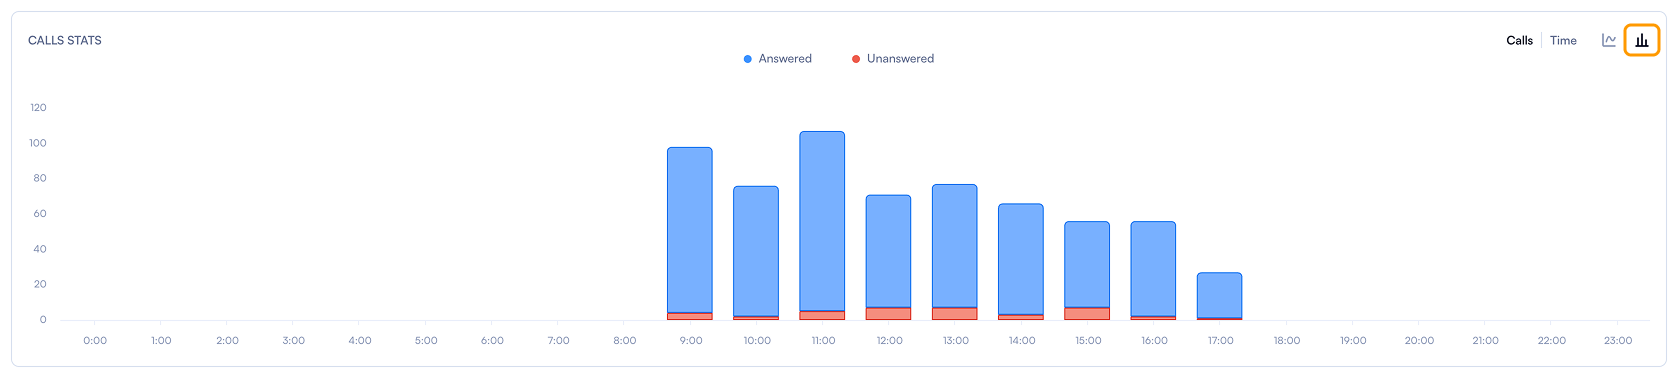
- Answered (Blue Line): This line represents the number of calls that were answered over time. The area under the blue line indicates the volume of answered calls.
- No Answer (Red Line): This line represents the number of calls that were not answered over time. The area under the red line indicates the volume of unanswered calls.
Toggle options:
- Calls / Time: This option allows switching between viewing the number of calls and the duration of calls over time.
Calls option
Time option
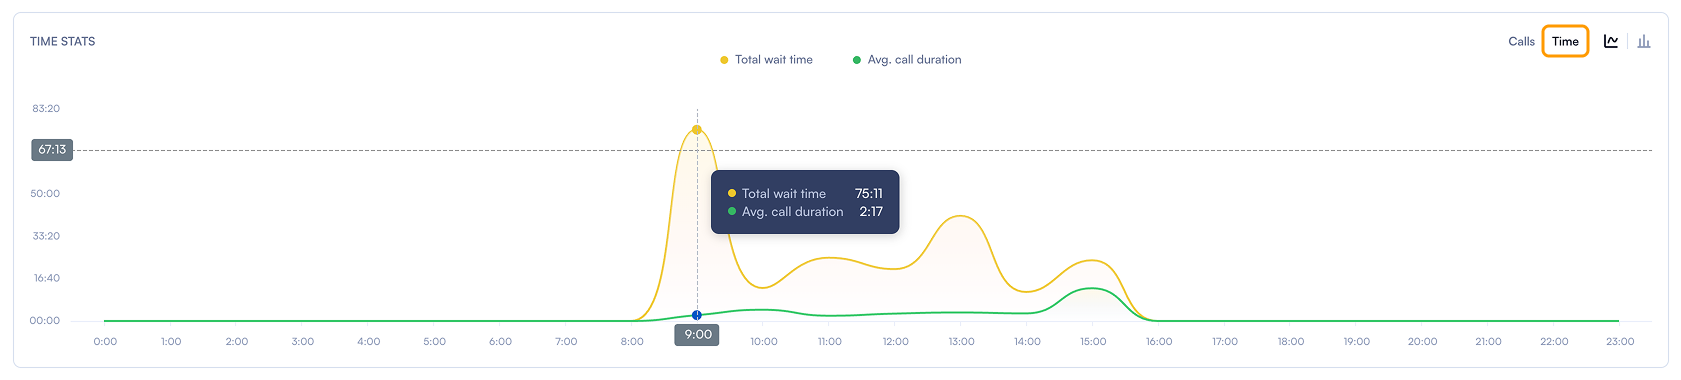
Chart Type: This option allows switching between different types of charts (line and bar chart) to visualise the data.
Bar chart
Queues Section
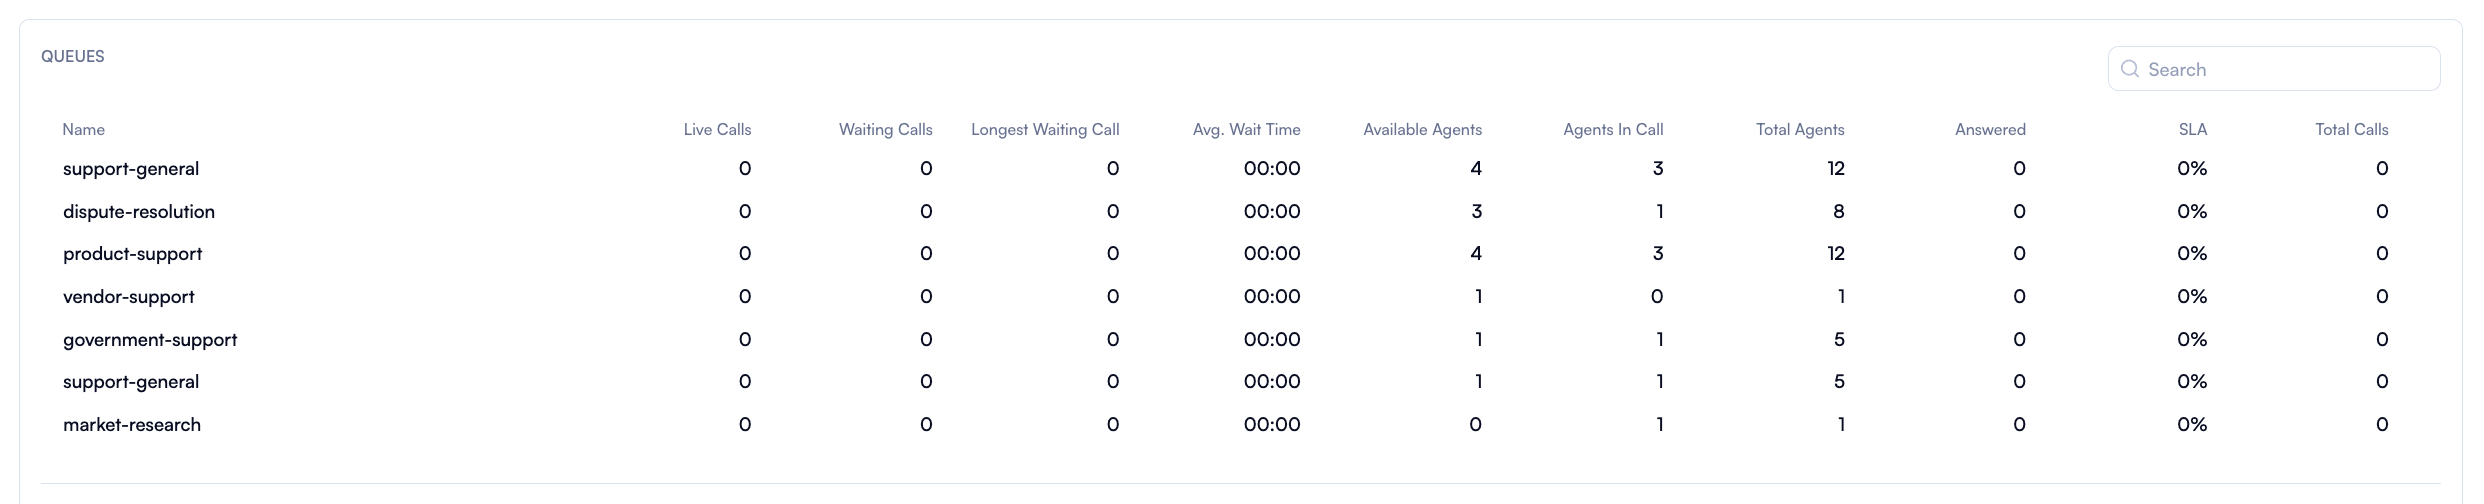
You can see a detailed breakdown of Call Queues with the following columns:
| Type | Explanation |
|---|---|
| Name | The name of the queue (e.g., Returning customers, Client support, Escalated calls, etc.) |
| Live calls | Number of calls currently live in the queue. |
| Waiting calls | Number of calls waiting in the queue. |
| Longest Waiting Call | The longest time a call has been waiting in the queue. |
| Avg. Wait Time | The average waiting time for calls in the queue. |
| Available agents | Number of agents available for the queue. |
| Agents in call | Number of agents currently on a call in the queue. |
| Total agents | Total number of agents assigned to the queue. |
| Answered | Number of calls answered in the queue. |
| SLA | Service Level Agreement percentage, indicating the proportion of calls answered within a certain time. |
| Total calls | Total number of calls handled by the queue. |
Agents Section
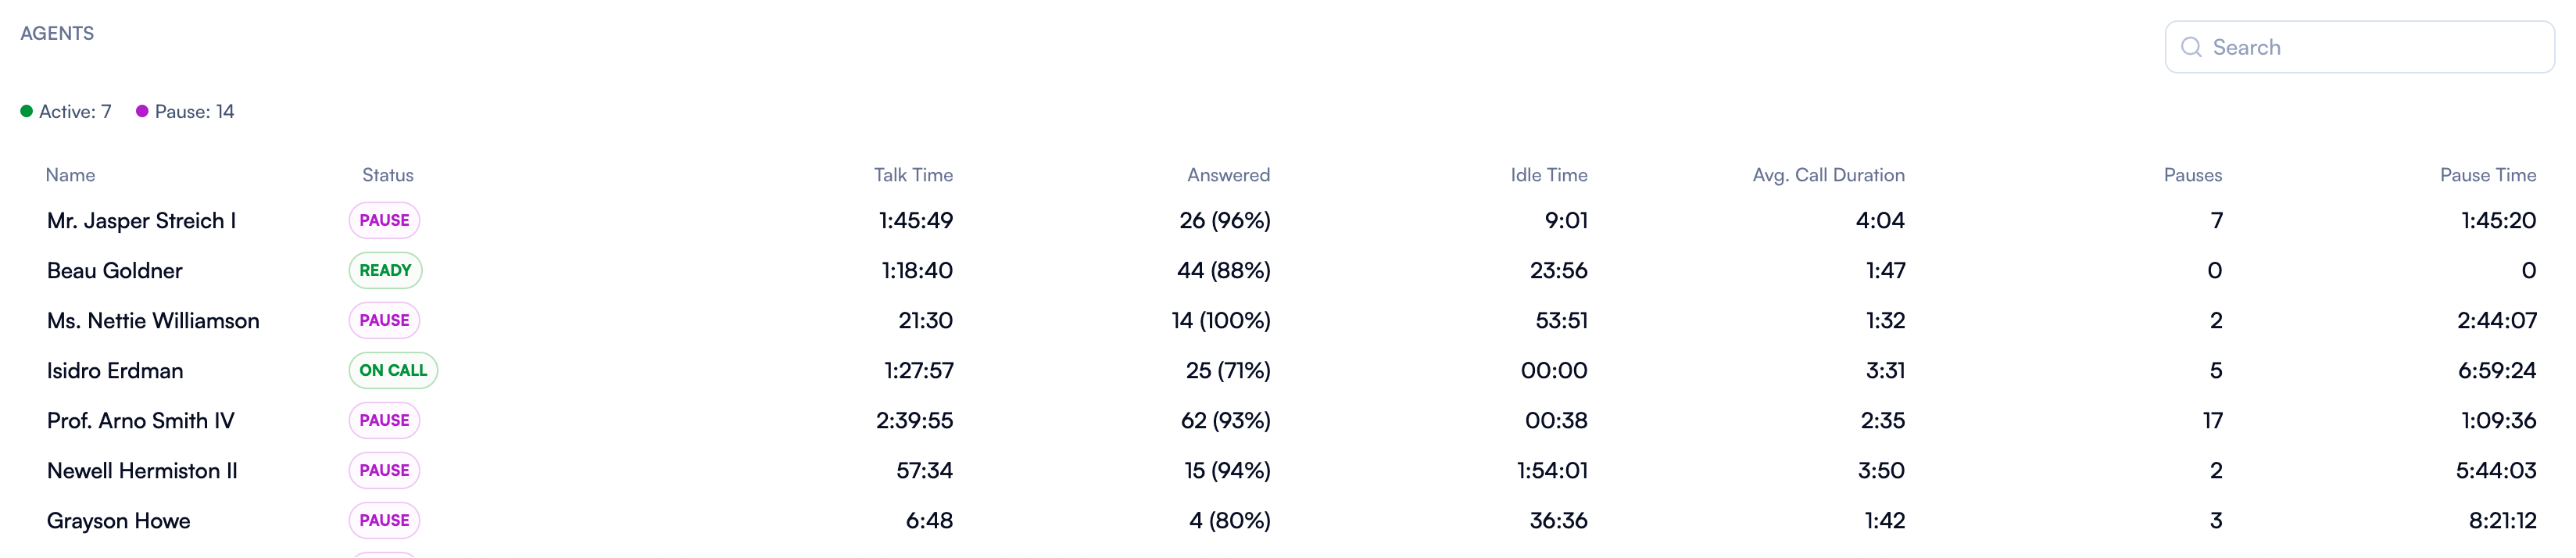
Here, you can see a detailed breakdown of agent performance with the following columns:
| Type | Explanation |
|---|---|
| Summary | A glimpse over the status: Active, Idle, Break and Offline |
| Status | Current status of the agent (e.g., On Call, Idle, Break, Offline). |
| Name | A column with all the agents name. |
| Talk time | Total talk time of the agent. |
| Answered | Number of calls answered by the agent. |
| Idle time | Total idle time of the agent. |
| Avg. call duration | Average duration of calls handled by the agent. |
| Pauses | Number of breaks taken by the agent. |
| Pause time | Total time spent on breaks by the agent. |
| Search | Search option when you are looking for a specific agent. |
How to use the insights from the Dashboard
Monitoring: Use the dashboard to monitor real-time call activity, agent performance, and queue statistics.
Performance Analysis: analyse the performance of different queues and agents using the detailed statistics provided.
Resource Allocation: Adjust resources based on the insights gained (e.g., assigning more agents to queues with high wait times).
SLA Management: Ensure that Service Level Agreements are being met by tracking the SLA percentages.
Agent view
If you are an agent, to access PBX.IM, simply go to https://app.pbx.im/login and enter the credentials you created when you received the invitation from your manager. As an agent, you will be able to view the following reports:
- Activity time
- Call talk time
- Idle time
- Pause time
We will go through each of the following sections one by one and explain how you can use them:
- Filter section
- Summary
Filter section

Here you can see the current date, time, and status.
Summary

On the ''Summary'' you can see an overview regarding your activity.
| Type | Explanation |
|---|---|
| Activity time | Total activity time for the day including the pauses, calls and idle time. |
| Call talk time | Total duration of ring time attempting to reach customers and percentage of time spent on calls. |
| Idle time | Total time you were neither on the phone nor paused. |
| Pause time | Total daily pause duration including billable or non-billable time. |
Call Stats
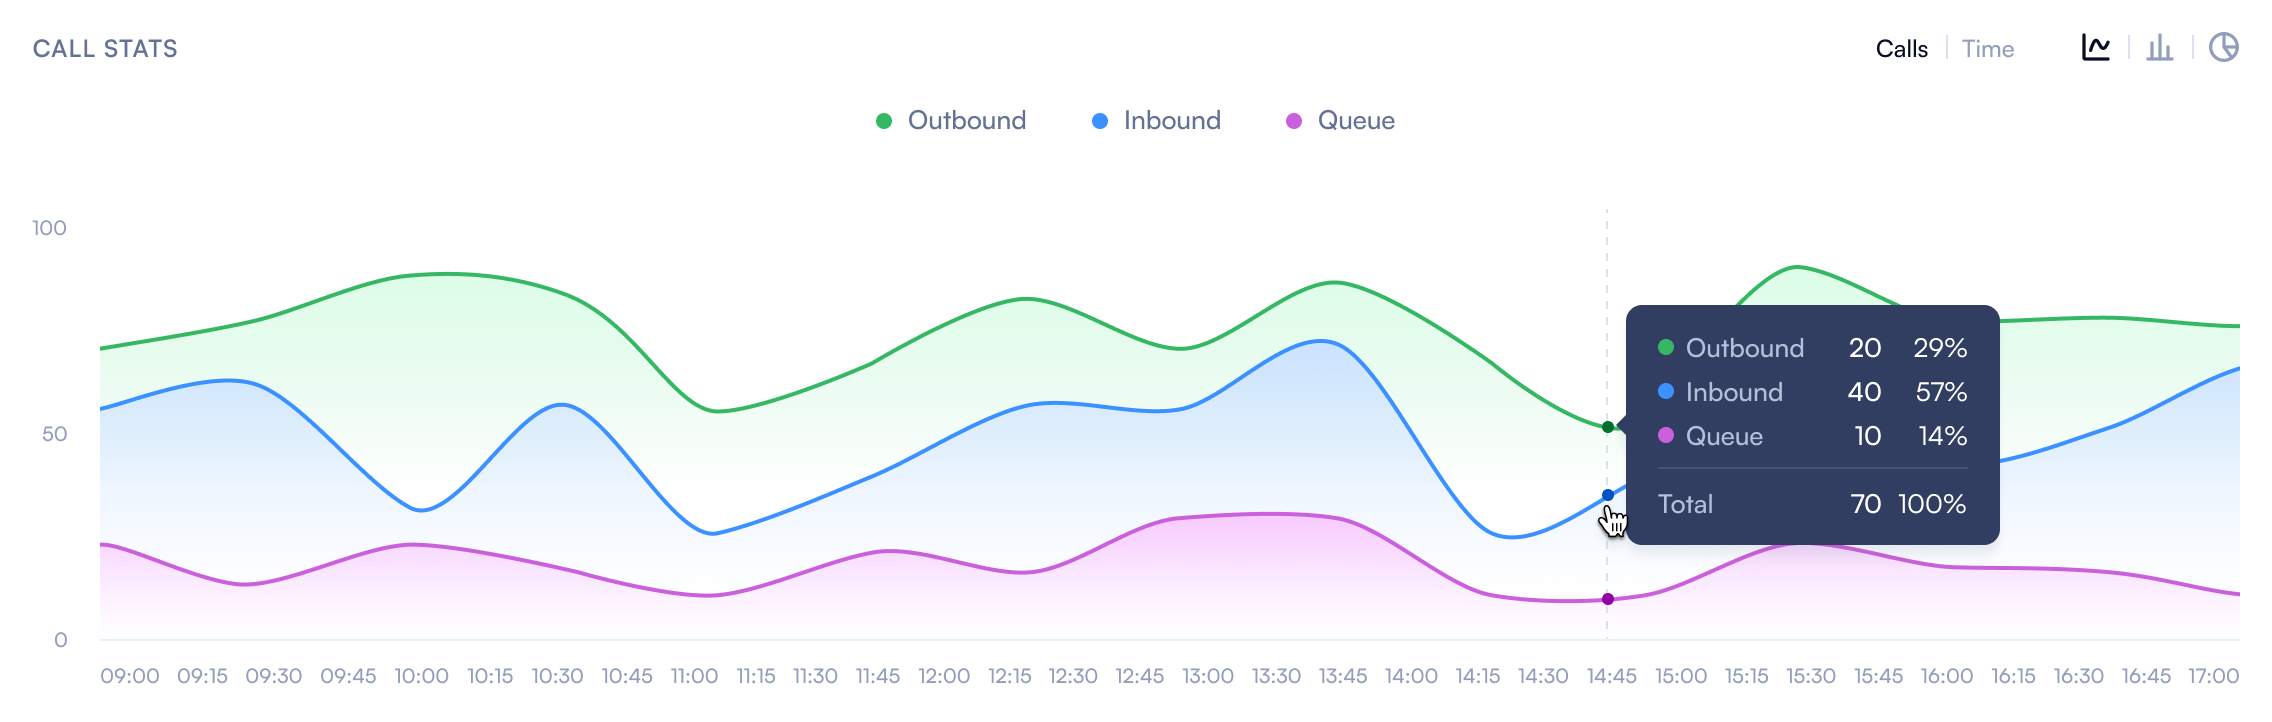
Here you will see an overview of the Queue Call situation.
How to use it:
Chart:
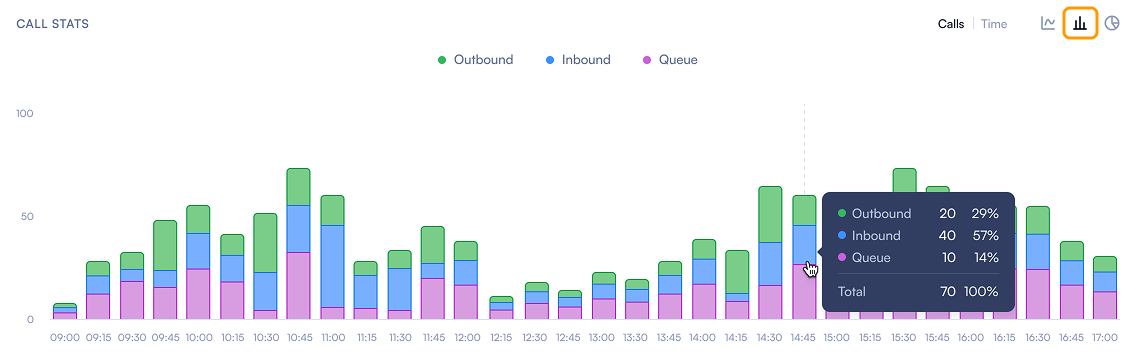
- Outbound (Green Line): Represents the number of outbound calls.
- Inbound (Blue Line): represents the number of inbound calls.
- Queue (Purple Line): represents the number of calls in the queue.
Toggle Options:
- Calls Toggle: This option allows switching between viewing the number of calls and the duration of calls over time.
In the Queue Call Stats section, you have multiple filters available:
- Time-based filter
- Chart type filter
Calls option
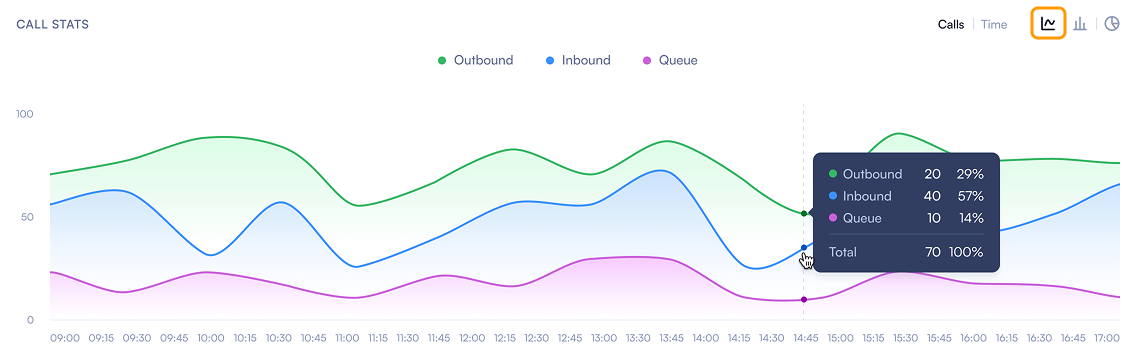
Chart Type Toggle: This option allows switching between different types of charts (e.g., line chart, bar chart) to visualise the data.
Bar chart