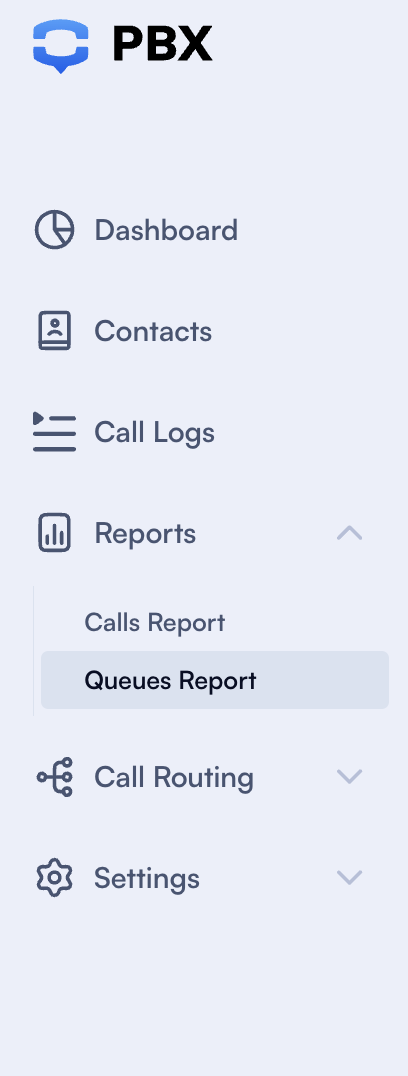
Queues Reports
Table of Contents
Introduction to Queues Reports
Queues Reports, as the name suggests, is a PBX.IM's feature that displays report results based on the KPIs you've set under General .
How to generate a report?
Go to Reports. Log into your account, navigate to the Reports section, and select 'Queue Reports.'
Once you log in you will see the full page where you can set the parameters for your report.
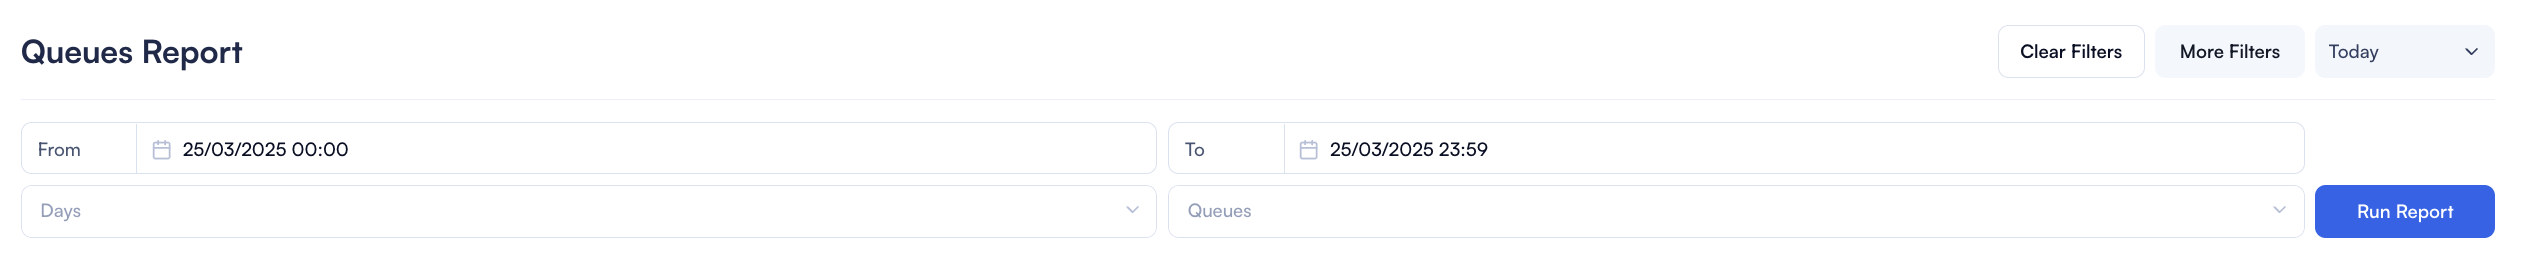
| Field | How to use |
|---|---|
| From Date and Time | Select the starting date and time for the report period. |
| To Date and Time | Select the ending date and time for the report period. |
| Days | Choose specific days for filtering the report. Select from the dropdown menu the specific days. |
| Phone Numbers | Filter by phone numbers if needed. You can choose it from the list available. |
| Unique Calls Toggle | Toggle to include only unique calls in the report. |
| Clear Filters Button | Clear all selected filters to reset the report criteria. |
| Less Filters Button | Reduce the number of filter options displayed. |
| Create Report Button | Generate the report based on selected filters and settings. |
Once you click Generate Report you will see the results color coded according to the KPIs you set under General .
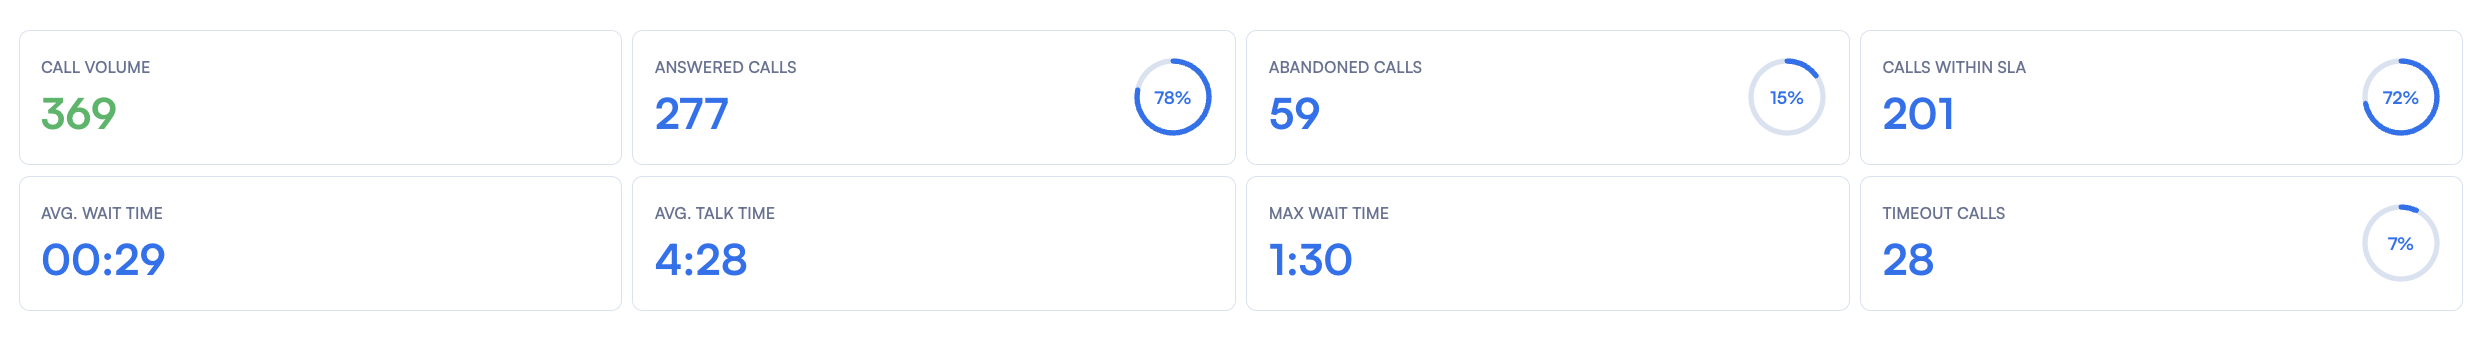
| Field | How to use |
|---|---|
| Call Volume | Total number of calls received in the selected time period. |
| Answered Calls | Total number of calls that were answered by agents, displayed with percentage. |
| Abandoned Calls | Total number of calls that were abandoned by the caller, displayed with percentage. |
| Calls Within SLA | Total number of calls that were handled within the Service Level Agreement (SLA), displayed with percentage. |
| Avg. Wait Time | Average time a caller waited before being answered. |
| Avg. Talk Time | Average time agents spent talking with callers. |
| Max Wait Time | Maximum time a caller waited before being answered. |
| Timeout Calls | Total number of calls that timed out without being answered, displayed with percentage. |
Detailed Queues Report
Below the numbers report you can see detailed report based on queues.
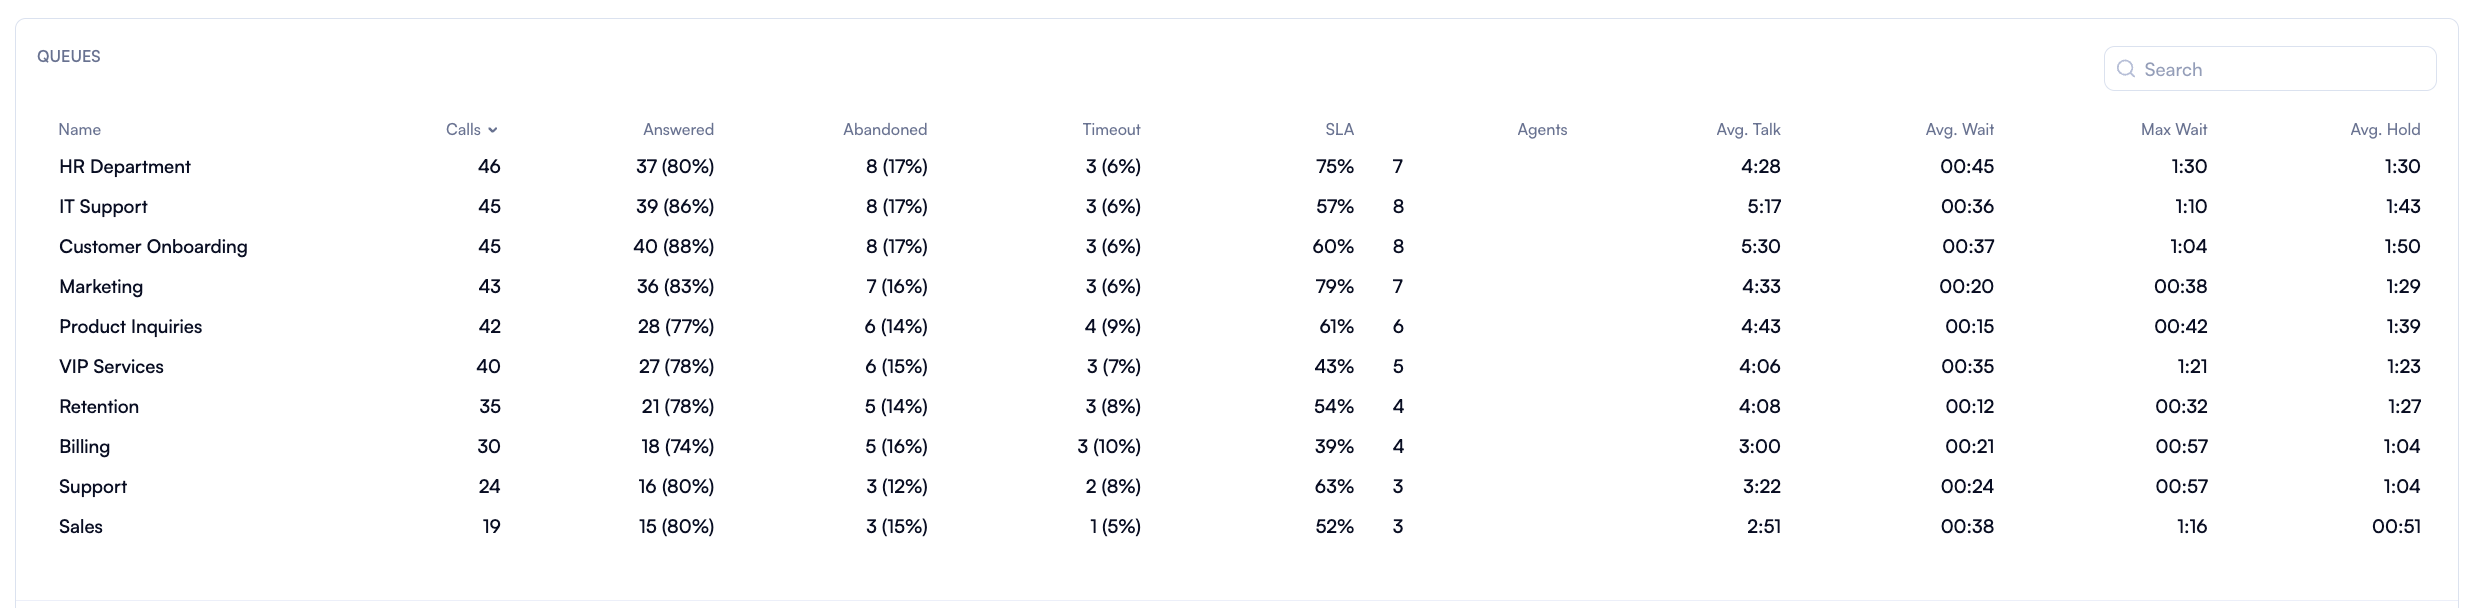
| Field | How to use |
|---|---|
| Name | Name of the queue being reported. |
| Calls | Total number of calls received by each queue. |
| Answered | Total number of calls answered, with percentage of total calls in parentheses. |
| Abandoned | Total number of calls abandoned by callers, with percentage of total calls in parentheses. |
| Timeouts | Total number of calls that timed out, with percentage of total calls in parentheses. |
| SLA | Percentage of calls that met the Service Level Agreement (SLA) criteria. |
| Agents | Number of agents handling calls in each queue. |
| Avg. Talk | Average duration of answered calls (talk time). |
| Avg. Wait | Average time callers waited before their calls were answered. |
| Max Wait | Maximum wait time experienced by callers. |
| Avg. Hold | Average hold time experienced by callers in each queue. |
Detailed Agent Report
Another section that you can use is the one where you can see a detailed report for each agent.
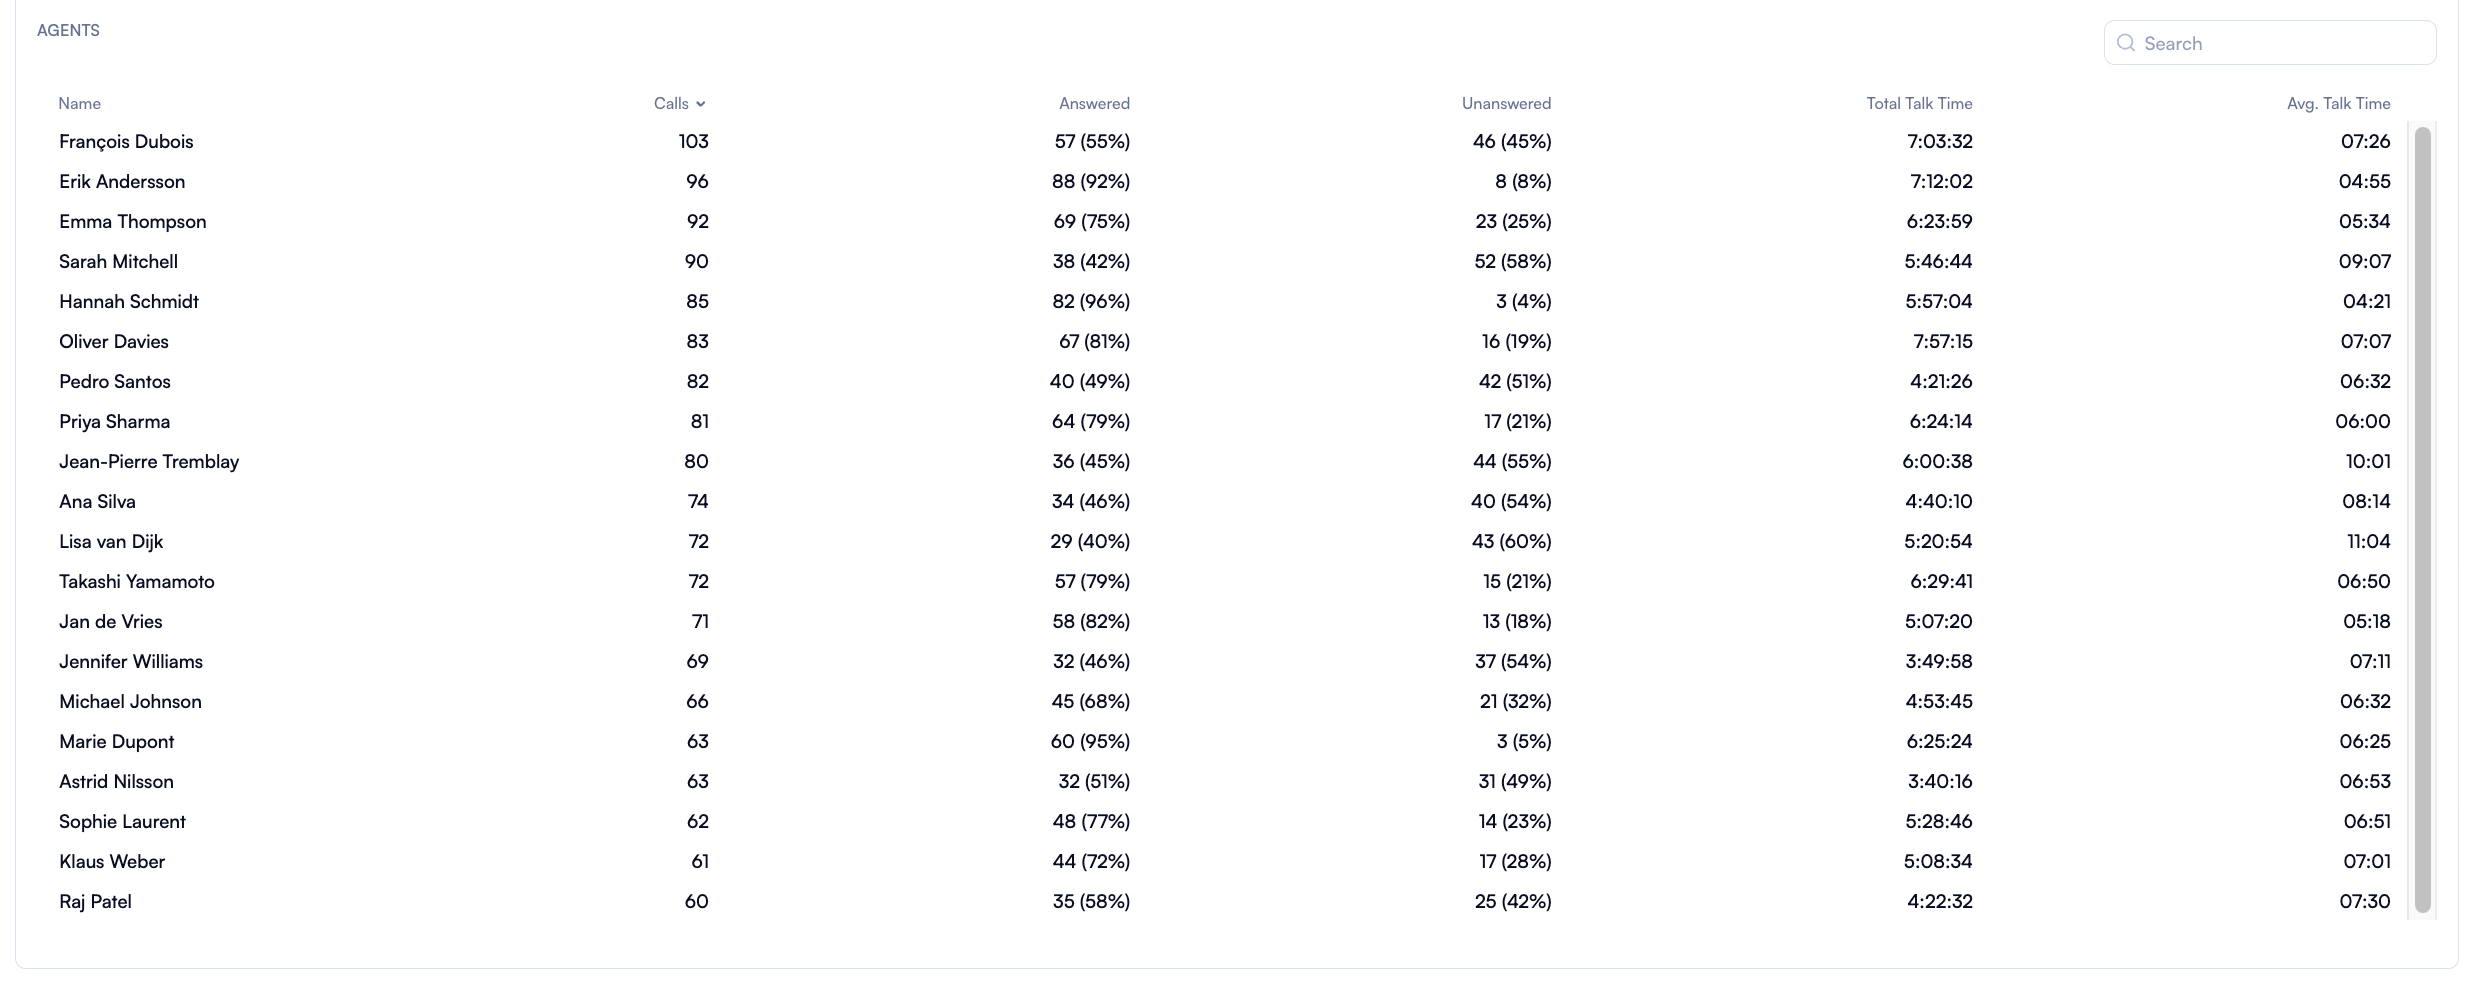
| Field | How to use |
|---|---|
| Name | Name of the agent handling the calls. |
| Calls | Total number of calls assigned to each agent. |
| Answered | Total number of calls answered by the agent, with percentage of total calls in parentheses. |
| Missed | Total number of calls missed by the agent, with percentage of total calls in parentheses. |
| Talk Time | Total talk time spent on answered calls by the agent. |
| Avg. Talk | Average talk time per call handled by the agent. |
Note that the maximum time range you can select for the report is 3 months.